DEG by Machine Learning
- 데이터를 사용하여
- 기계학습 모델을 학습시키고
- 기계학습 모델에서 중요하게 사용된 특성(feature)에 대해
- 특성 중요도(feature importance)를 계산
=> 특성 중요도(feature importance)를 기준으로 DEG 선정

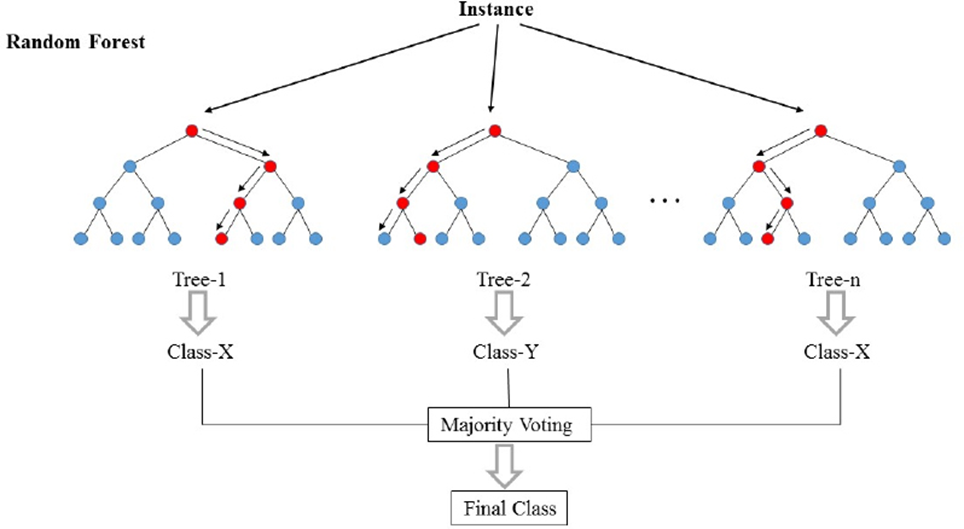
Decision Tree

Random Forest Generation

Random Forest Prediction

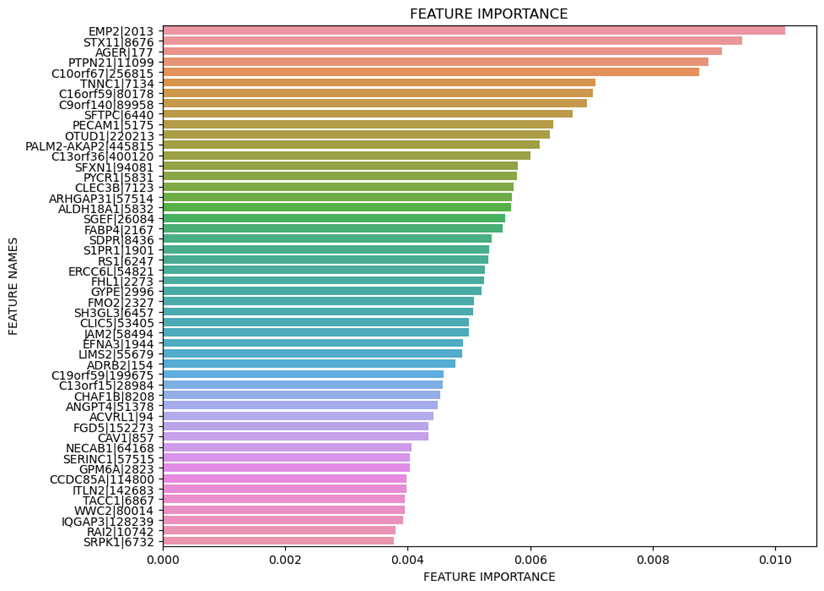
Feature Importance

실습 코드
import pandas as pd
data=pd.read_csv("LUAD.txt",delimiter="\t",skiprows=lambda x: x == 1,index_col=0)

lst_labels = []
for col in data.columns:
    # if col = "TCGA-05-4244-01A-01R-1107-07", then sample_type = "01A"
    sample_type = col.split('-')[3]
    if sample_type.startswith("01"): # primary tumor
        lst_labels.append('cancer')
    elif sample_type.startswith("02"): # reccurent solid tumor
        lst_labels.append('cancer')
    elif sample_type.startswith("10"): # blood derived normal
        lst_labels.append('normal')
    elif sample_type.startswith("11"): # solid tissue normal
        lst_labels.append('normal')
    else:
        lst_labels.append('normal')
        print("Warnning: sample type out of options")

import sklearn
# random forest for feature importance on a classification problem
from sklearn.ensemble import RandomForestClassifier
from matplotlib import pyplot
# define the model
model = RandomForestClassifier(n_estimators=2000)
# fit the model
model.fit(data.T, lst_labels)

importance = model.feature_importances_

import seaborn as sns
import matplotlib.pyplot as plt

fi_df = pd.DataFrame({'feature_names':data.index,'feature_importance':importance})

#Sort the DataFrame in order decreasing feature importance
fi_df.sort_values(by=['feature_importance'], ascending=False,inplace=True)

#Define size of bar plot
plt.figure(figsize=(10,8))
#Add chart labels
plt.title('FEATURE IMPORTANCE')
plt.xlabel('FEATURE IMPORTANCE')
plt.ylabel('FEATURE NAMES')
#Plot Searborn bar chart
sns.barplot(x=list(fi_df.head(n=1000)['feature_importance']), y=list(fi_df.head(n=1000)['feature_names']))
plt.show()

import numpy as np
lst_log2fold_change = []
lst_overone_ratio=[]

for i in range(data.shape[0]):
    # load i-th row (i.e, data of gene i)
    line= list(data.iloc[i,:])

    # For computing log2 fold change of gene i
    lst_cancer_vals=[]
    lst_normal_vals=[]
    for j in range(len(line)):
        if lst_labels[j] == 'cancer':
            lst_cancer_vals.append(line[j])
        elif lst_labels[j] == 'normal':
            lst_normal_vals.append(line[j])
    log2fold_change = np.log2((np.mean(lst_cancer_vals)+1) / (np.mean(lst_normal_vals)+1))
    lst_log2fold_change.append(log2fold_change)

    # For computing over one ration of gene i
    lst_overone=[]
    for j in range(len(line)):
        if line[j] > 1:
            lst_overone.append(1)
        else:
            lst_overone.append(0)
    overone_ratio = sum(lst_overone)/len(lst_overone)
    lst_overone_ratio.append(overone_ratio)

lst_isDEG=[]
for i in range(data.shape[0]):
    log2fold_change = lst_log2fold_change[i]
    feature_importance = importance[i]
    if feature_importance > 0.00001 and log2fold_change > 0:
        isDEG = 1
    elif feature_importance > 0.00001 and log2fold_change < 0:
        isDEG = -1
    else:
        isDEG = 0
    lst_isDEG.append(isDEG)

res_final = pd.DataFrame({'gene':data.index,'feature_importance':importance,'RFDEG':lst_isDEG})
res_final["RFDEG"].value
_counts()
728x90
'Bioinformatics' 카테고리의 다른 글
| 정보의학개론 - 의학 자료의 특성 (0) | 2021.09.08 |
|---|---|
| 바이오 마커 후보 유전자 사후분석(Gene Ontolohy) (0) | 2021.08.25 |
| 통계적 방법에 따른 DEG 분석 (R) (3) | 2021.08.25 |
| Fold change에 따른 DEG 분석(Python) (0) | 2021.08.25 |
| 바이오마커 유전자 분석 (0) | 2021.08.24 |
