DEG by Statistical test
- 유전자 발현 데이터를 사용하여 표본 통계량(평균, 표준편차 등)을 구함
- 표본 통계량을 통해 모집단의 분포를 가정
- 실험/대조군의 차이를 유의확률(p-value)로 나타냄
- 일반적으로 p-value<0.05인 유전자를 DEG로 결정
P-value and Empirical Testing of Differential Expression
귀무가설이 맞다고 가정할 때 얻은 결과보다 극단적인 결과가 실제로 관측될 확률
In statistical hypothesis testing, the p-value is the probability of finding the observed, or more extreme value, when the null hypothesis (H0) is true.
p-value가 작다 -> 극단적인 값이 나올 확률이 적다.
p-value가 작을수록 현재 관찰한 값이 극단적이라는 얘기(차이가 크다)
P-value에 대해 좀 더 자세한 내용은 아래 블로그 참고
p-value의 의미 - 공돌이의 수학정리노트
angeloyeo.github.io
P-value and Empirical Testing of Differential Expression
- Normal cell: 1, 2, 2, 2, 3
- Cancer cell: 2.5
인 경우를 가정해보자.
Empirical p-value = 1/5 = 0.2 이므로 0.05를 넘지 않는다. => DEG가 아님
표본 통계값으로 만들어낸 정규 분포를 바탕으로 Parametric P-value를 계산

Gene Expression data and probability distribution
Microarray Data

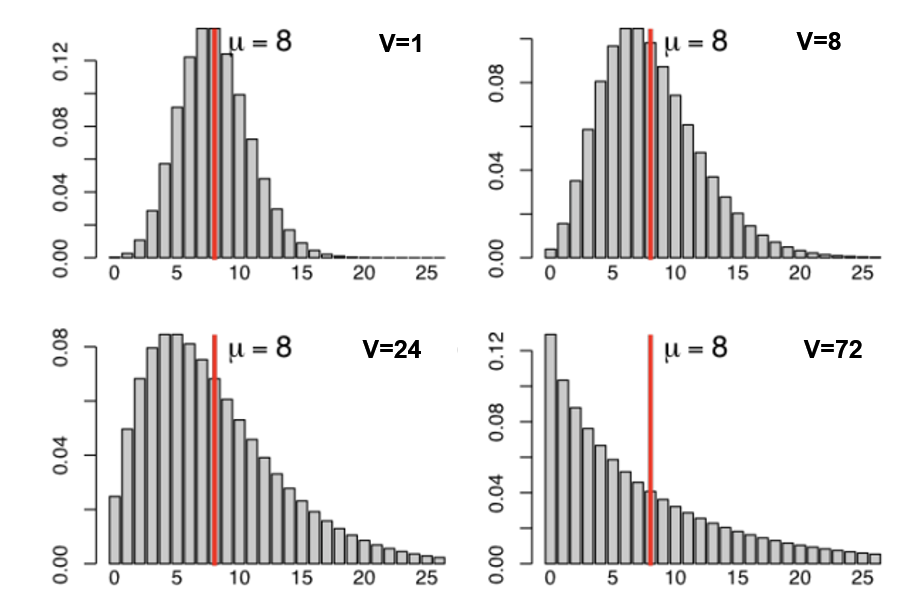
RNA-Seq Data(Negative binomial distribution)

RNA-Seq Data는 일반적으로 negative binomial 분포를 가정한다.

DEG Tools

- 최근에는 DESeq2, edgeR, EBSeq 을 많이 쓰는 추세
- 여러 Tool을 돌리고 교집합을 취하기도 함
Parametric을 주로 씀
DEG 분석 흐름
- Normalization
- Dispersion estimation
- Log fold change estimation
- Statistical testing
- Multiple testing correction (Bonferroni, FDR)
- Filtering (p-value, fold change, at least expression)
Multiple Testing
- 유전자 하나에 대한 통계량을 구함(평균, 표준편차) -> 분포를 가정한 후(Negative binominal) -> p-value를 구함
- 유전자 하나만 하는 것이 아니고 수많은 유전자를 대상으로 위 과정을 진행
- 여러 테스트를 반복할수록 결정이 틀릴 확률이 중첩이 되서 점점 올라감
- 이를 해결할 수 있는 방법(Correction for multiple testing)
- Bonferroni correction
- Benjamini–Hochberg procedure
Bonferroni correction/Benjamini–Hochberg procedure를 이용한 P-value 조정
N=1000, significance=0.05인 상황을 가정해보자.
Bonferroni correction

Benjamini–Hochberg procedure

실습 코드(R)
library(DESeq2)
header <- read.csv("LUAD.txt", sep='\t', header=TRUE, row.names = 1, nrows=1)
data <- read.csv("LUAD.txt", sep='\t', skip=2, header=FALSE, row.names = 1)
colnames(data) <- colnames(header)
head(data)

countData <- sapply(data, as.integer)
rownames(countData) <- rownames(data)
head(countData)

condition <- c()
for (col in colnames(data)){
    # if col = "TCGA-05-4244-01A-01R-1107-07", then sample_type = "01A"
    sample_type <- substr(col, 14, 15)
    if (sample_type == "01"){ condition=c(condition, "B_cancer")}
    else if (sample_type == "02"){ condition=c(condition, "B_cancer")}
    else if (sample_type == "10"){ condition=c(condition, "A_normal")}
    else if (sample_type == "11"){ condition=c(condition, "A_normal")}
    else { condition=c(condition, "A_normal")}
}
condition <- factor(condition)
head(condition)

dds <- DESeqDataSetFromMatrix(countData, DataFrame(condition), ~ condition)
#dds <- dds[ rowSums(counts(dds)) > 1, ]
dds <- DESeq(dds)

res <- results(dds)
head(res)

isDEG <- (res$padj < 0.00000000001) * sign(res$log2FoldChange)
isDEG[is.na(isDEG)] <- 0
table(isDEG)

res_final <- cbind(rownames(res), res$padj, isDEG)
colnames(res_final) <- c("gene","adj-p","DESeq2DEG")
head(res_final)

write.table(res_final, file="LUAD.DESeq2", sep="\t", quote = F, row.names = F, col.names = T)
728x90
'Bioinformatics' 카테고리의 다른 글
| 바이오 마커 후보 유전자 사후분석(Gene Ontolohy) (0) | 2021.08.25 |
|---|---|
| 머신러닝을 이용한 DEG 분석 (0) | 2021.08.25 |
| Fold change에 따른 DEG 분석(Python) (0) | 2021.08.25 |
| 바이오마커 유전자 분석 (0) | 2021.08.24 |
| TCGA 데이터 (0) | 2021.08.24 |
